What is an Indicator?
Indicators measure what our community cares about and track whether we’re moving in the right direction. Without indicators, it is difficult to know whether progress is being made on important issues. These metrics provide essential guidance for community leaders, elected officials, and funders to make informed, strategic decisions to drive change.
How are indicators chosen?
First, we look to best practice examples across our country. We are proud to be a member of the Community Indicators Consortium. To ensure that our indicators are meaningful for our region, we have a team of data experts that come together regularly to review our indicators and data. This Data Consortium also works closely with our Action Teams, made of subject matter experts in our eight priority areas.
How is data collected?
We rely on national data providers (like the U.S. Census and Bureau of Labor Statistics), state data providers (like the Department of Education), and additional analytics (through Chmura Economics Analytics). We also work with local organizations (like our universities and nonprofits) to analyze existing data-sets. Every indicator on this website is credited with the appropriate source.
How often do you update the data?
Most of our indicators are updated on a yearly basis. For those that we can get more often, we do. Let us know if you see something that is not up-to-date by visiting our contact page.
What is considered “the region”?
We use the Richmond Metropolitan Statistical Area (MSA) to compare the Richmond Region to our peer regions. The MSA includes: the cities of Richmond, Hopewell, Petersburg, and Colonial Heights; the counties of Amelia, Caroline, Charles City, Chesterfield, Dinwiddie, Goochland, Hanover, Henrico, King William, New Kent, Powhatan, Prince George, Sussex; and the towns of Ashland and Bowling Green.
For indicators specific to our region (or when we look individually at jurisdictions), we use the footprint of the Capital Region Collaborative: the City of Richmond, the Town of Ashland, and the Counties of Charles City, Chesterfield, Goochland, Hanover, Henrico, Powhatan, and New Kent.
How were peer regions chosen and why do they matter?
Peer regions were chosen for their comparable size and composition. These same regions have been used in several studies by Richmond’s Future, Virginia Commonwealth University, and for the Richmond Region Comprehensive Economic Development Strategy.
Benchmarking ourselves against peer regions allows us to see where we are truly making impact versus improvements that come from national trends, changes to guidelines, etc. For example, an increase in graduation rates by 2% might seem good. But, it’s a different story if we see that our peer regions improved by 5%.
What does ranking mean?
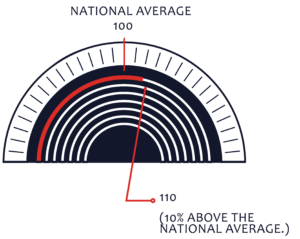
In the RVA Snapshot, we include a dashboard with rankings of peer regions. In order to group the indicators into one comparable value,  we’ve chosen to index them by priority areas relative to the United States average. For example, a value of 110 means the region is performing 10% above the national average. Note: It’s important to understand that the dashboards and rankings are meant to serve as a big-picture, comparative tool. To truly understand our strength, challenges, as well as our opportunities for impact, we must look at the individual statistics.
Where does your funding come from?
Funding for the Regional Indicators Project comes primarily from private foundations, such as The Community Foundation Serving Richmond and Central Virginia and Robins Foundation. Support for the 2016 RVA Snapshot came from the above foundations, as well ChamberRVA Foundation and Astyra Corporation. We also rely heavily on research and data-collection support from the Richmond Regional Planning District Commission and VCU’s Center for Urban and Regional Analysis.
Can I suggest or submit data that I think should be included?
Yes! Please go to our Contact page. Our Data Consortium team will review these recommendations to see if they are a strong measure of our community’s progress.
Who uses your data?
Nonprofits, foundations, city agencies, students, and business leaders all use our data to tell important stories that will inform future policies and progress in RVA. If you have used our data and analysis in your work, let us know! Share your story on our Contact page.
Can I use this data?
Yes, we hope you do! Beside many of our charts and graphs we have an easy-to-use share button for social media. This is a great way to advocate and educate others on pressing issues in our community.
For media inquiries or to request a speaker, please visit our Contact page.